

Behnam Baghianimoghadam ( Research Consultant, Shahid Sadoughi University of Medical Sciences, Yazd, Iran. )
Sedighe Akhavan Karbasi ( Department of Paediatrics, Shahid Sadoughi University of Medical Sciences, Yazd, Iran. )
Motahare Golestan ( Department of Paediatrics, Shahid Sadoughi University of Medical Sciences, Yazd, Iran. )
Mohammad Hasan Lotfi Kamran ( Department of Biostatics & Epidemiology, Shahid Sadoughi University of Medical Sciences, Yazd, Iran. )
December 2012, Volume 62, Issue 12
Original Article

Abstract
Objective: To assess the growth pattern of children in Yazd, and compare it with standards outlined by the World Health Organisation.
Methods: The cross-sectional study, which was conducted in 2009, involved 20 guidance schools of Yazd city. A total of 1921 children were chosen by simple cluster method and general demographic and anthropometric information regarding the subjects was extracted from students\\\' health identification booklets. Data was analysed through SPSS.
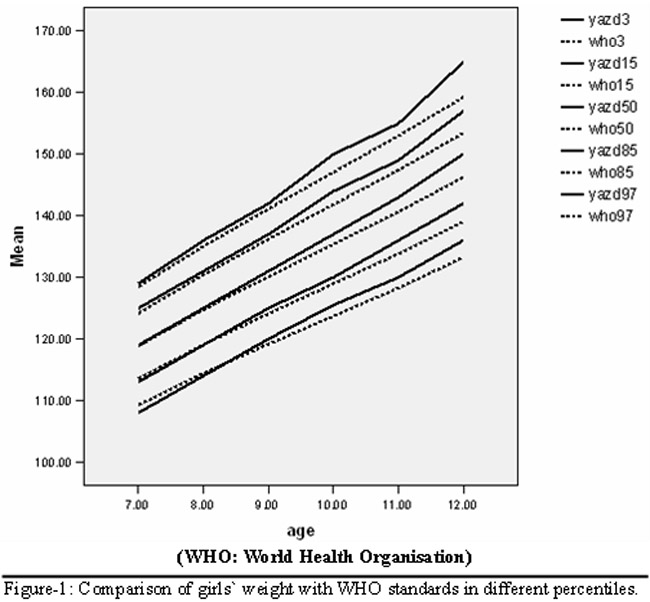
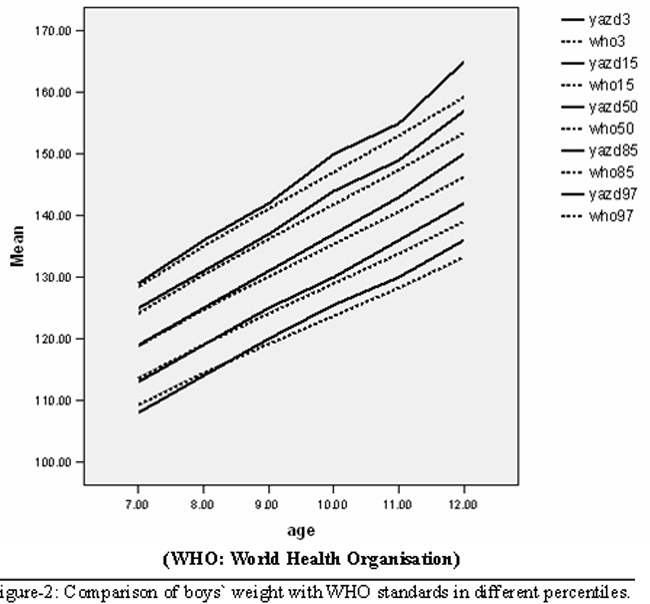
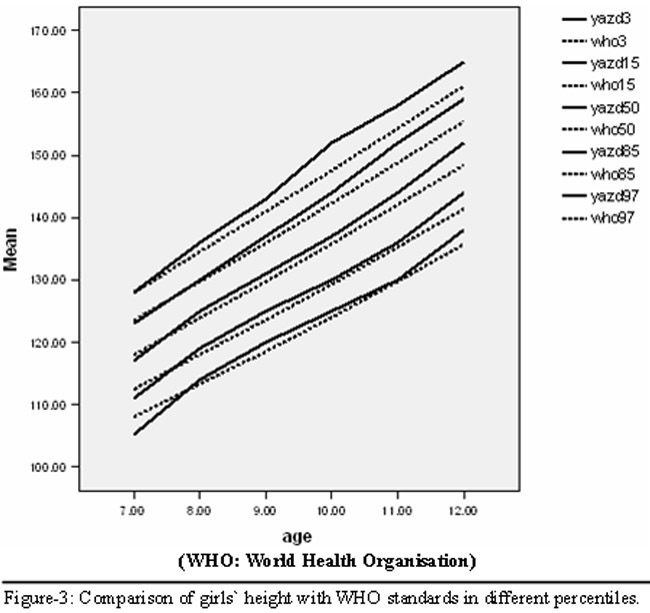
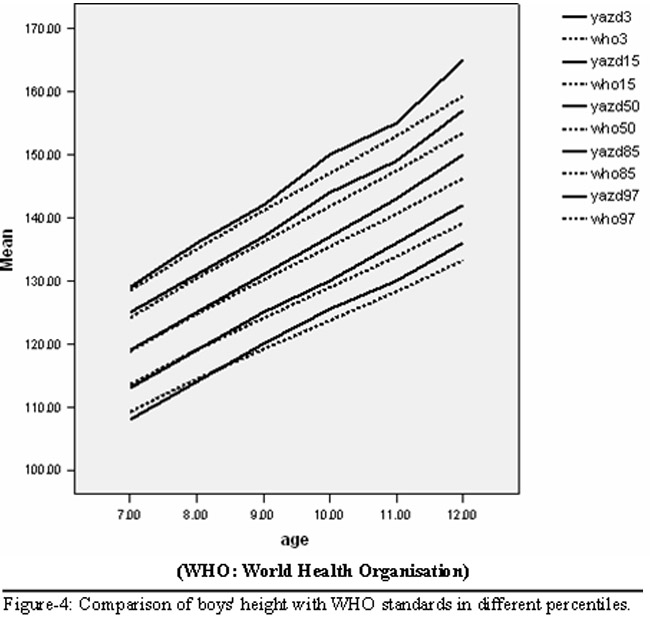
Results: The mean values of height in 7th and 12th years of age were 119±8.8cm and 150±6.6cm in boys and 117±5.97cm and 152±7.3cm in girls respectively. The mean values of weight in 7th and 12th years of age were 20±3.39kg and 39±1kg in boys and 20±3.78kg and 41±1.07kg in girls respectively. These values generally were below the values set by the World Health Organisation till the 9th year of age, and above them beyond the 9th year.
Conclusion: The growth pattern among children in Yazd is better than some of the other provinces in Iran. Larger studies are needed for generating Iran-specific standard for better assessment of the growth and nutritional status of Iranian children.
Keywords: Growth, Yazd city, WHO standards. (JPMA 62: 1289; 2012).
Introduction
The goal of paediatric care is to maximise each child\\\'s potential. It is necessary for physicians to understand the growth development and behaviour, in order to monitor children\\\'s progress, to determine any probable abnormality, and to counsel parents. Familiarity with developmental theory can enhance the potential of physicians in monitoring children\\\'s progress.1
In middle childhood (6-11 years) most children have issues with their parents, and want to be close to their teachers and peers.2 Height and weight growth during this period would be between 3-3.5kg and 6-7 cm per year. Growth occurs in 3-6 irregularly timed spurts each year; each spurt lasts an average 8 weeks. The head circumference will increase only 2-3cm during the entire period. Body habitus is more erect than previously, with long legs compared with trunk.3 Body fitness will decline and sedentary habit increases the rate of obesity in this phase.1 Growth charts are simple instruments to monitor growth parametres and nutritional status of children.4 International growth standards provide an equitable chance to compare data from different countries. Regional and national resources are also useful to assess the effect of nutritional change on children\\\'s growth.5,6 Anthropometric data enables experts to reach effective and trustable resources for different goals.7 Analysis of population growth pattern is widely dependent on standards that are used.8 Reliability of National Centre for Health Statistics (NCHS) 1977 standards as an international resource for monitoring growth is under doubt9-13 to some extent and some papers have discouraged its use.14-16 For correction of shortages, the Centre for Disease Control (CDC) recommended a new set of standards in 2003.9,17 Both these standards were based on American population. In 2006, the World Health Organisation (WHO) published its own set of growth curves for children less than 60 months of age based on a multi-centre study carried out in four continents.18 WHO believes that these resources not only create new standards for growth of children, but can also explain the expected growth pattern that any child must have in normal situation.19 These have been recommended instead of CDC standards.20,21 In 2007, the WHO published new standards for children aged 5-20 years. These standards were a result of merging the WHO standards related to 0-5 year-old children with the NCHS values for 1-24 year-old people.22
In Iran there are frequent cross-sectional studies about comparison of children\\\'s anthropometric data with NCHS standards, but there is no study with the WHO standards.
This study set out to determine the growth pattern of 7-12 year-old children in Yazd, a city in central Iran with good socioeconomic indicators.
Material and Method
The cross-sectional study was conducted in spring and summer of 2009 in Yazd city schools. The Ministry of Health and Medical Education in collaboration with the Ministry of Education had started a project to monitor and record the physical and psychological health status of Iranian students with the help of booklets called the Health ID Booklet. Yazd city happened to be one of the first pilot regions for that project in 2000. Besides, anthropometric data from Yazdi students was also available since 2000. Based on cluster sampling, we chose 20 schools (10 for boys and 10 for girls) randomly. The sample size was calculated on the basis of the following parameters: test power of 80%; d=1.5; and based on previous studies S=2). A total of 680 cases were needed for the study. The required data was extracted from Health ID Booklets and to fill the pre-designed questionnaire. The records related to the period between 2002 and 2008. The questionnaire explored demographic data, weight and height of all students between 7 and 12 years of age. In fact, we had 6 weights and 6 heights for each child. Children with incomplete booklets and with any diagnosed disease that could influence a child\\\'s growth were excluded. Data was extracted from the dossiers related to Iranian nationals only.
The WHO data was obtained from its website. WHO had categorised its data by month and had placed it on its website in Pdf and Exel formats. Our data had been gathered on a monthly basis too. In fact, we had written our cases birth dates and also the time of measurement that was the first month of a new school session, which is September 23 in Iran. The WHO had reported its curves by years of age (not month). We, therefore, calculated back the two sets of data in terms of years, and then generated our curves.
We also remeasured weights and heights of 200 children at seven years old and compared them with the readings in the booklets. Data was transferred to SPSS, version 16 and the mean and SD of each age weight and height were calculated and analysed by single T test.
Results
We initially completed 2100 questionnaires and after the exclusion of incomplete questionnaires, 1921 (91.4%) children were included in the study. Of them, 938 (48.8%) were female and 983 (51.2%) were male. From all the fathers, 592 (30.8%) had <9 years, 482 (25.1%) had 9-11 years, 644 (33.5%) had 12-14 years, and 203 (10.2%) had >14 years of graduation. Among the mothers, the numbers were: 809 (42.1%), 474 (24.7%), 543 (28.3%) and 95 (4.9%) respectively. Of all the parents, 1221 (63.6%) had no family relations prior to marriage; 334 (17.4%) had close family relations, 126 (6.6%) had near-close, and 240 (12.5%) had distant family relations. Regarding family size, 237 (17%) families had less than 3 members, 838 (43.6%) 4, 417 (21.7%) 5, and 338 (17.6%) had more than 5 members.
The weight and height of Yazdi girls and boys were compared at different points with WHO data11 (Table; Figures-1-4).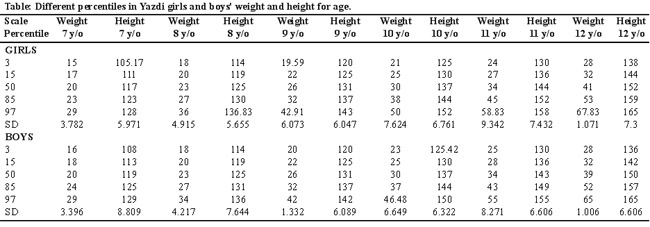
Discussion
Growth is one of the main scales for health. Detection of chronic diseases and interpersonal relationships and stress screening in children is possible by following a child and his family over time through growth charts. A paediatrician can detect relationships between physical, cognitive and motor growth.
Saeed ebrahimzade conducted a study in Shiraz, Mashhad and Urumia in 2003. All heights and weights of the study were higher than ours.23 This results has been repeated in Ali Sohrabi’s study24 in 2002, Freydoun Azizi’s study in 1986 in Tehran,25 and Taghavi’s study in 2008 in Shahroud.26
Mustafa in Saudi Arabia measured heights and weights which were lower than our results.27 This study had low number of cases and there were no more than 230 children in any age group.
Another study in Assam, India,28 measured mean scores, and had much different results, highlighting severe malnutrition in that area of India. Another study in 2005 in Punjab, India,29 measured mean scores which were higher than some of our scores.
In 1999, a study in Rasht, Iran, calculated mean scores which were higher than ours.30 All Iranian studies showed that Iranian children\\\'s height and weights were lower than NCHS (1977 scores) mean scores. None of these studies compared its results with WHO standards.
Only the Babol study31 had a study design similar to our study, but it only involved girls. Results of the Babol study were similar to ours; though our mean scores were somewhat higher. The Babol study followed the children till 15 years of age, while we stopped at 12.
Heights and weights in our study were lower than international scores initially, but gradually matched them and finally crossed them after the 10-year work. This can be due to Iranian genetic specifications.
Different and varying results in Iranian surveys indicated that different geographic, economic and nutritional situations and even nutritional habits in different areas of Iran can influence children\\\'s growth. One more reason for these differences could be the different study design. All other studies conducted in Iran didn\\\'t follow a specific group of children across time. They measured anthropometric data at a specific time period involving children of different ages. Our study, however, analysed anthropometric data of 1921 cases over 5 consecutive years. In this way, we tried to partly limit the bias of the other studies.
Conclusion
Although Yazdi children have a a positive growth pattern, but considering the geographic, cultural and economic differences in various Iran regions, our results should only be generalised conservatively. A longitudinal study with proper supervision is recommended to obtain more valuable and accurate data about the Iranian population.
Conflict of interest and Financial Support:
This study was under financial support of faculty of medicine, Shahid Sadoughi University of medical sciences, Yazd, Iran as part of Dr. Behnam Baghianimoghadam dissertation for graduation as General Practitioner. Other authors declare no conflict of interest.
Acknowledgement
The authors are thankful to Yazd Education Organization, School Health Office for its cooperation, and also thankful to Dr. Mehrdad Shakiba for his watchful consultations.
References
1. Paul L. McCarthy. The Well Child In: Kliegman, Behrman, Jenson, Stanton. NELSON textbook of Pediatrics, 18th ed. Saunders, 2007; pp 33-43.
2. Wells RD, Stein MT, seven to ten years. The world of middle childhood. In Dixon SD, Stein MT (editors): Encounter with children. Pediatric behavior and development. St Louis. MOSBY 2000; pp 402-25.
3. Krebs HF, Jacobson MS. American Academy of Paediatrics, committee on Nutrition; prevention of paediatrics overweight and obesity. Paediatrics 2003; 112: 414-30.
4. Bordom JH, Billot L, Gueguen R, Deschamps JR. New growth charts for Libyan preschool children. East Mediterr Health J 2008; 14: 1400-12.
5. Habicht JP, Martorell R, Yarbrough C, Malina RM, Klein RE. Height and weight standards for preschool children. How relevant are ethnic differences in growth potential? Lancet 1974; 1: 611-4.
6. Goldstein H, Tanner JM. Ecological considerations in the creation and the use of child growth standards. Lancet 1980; 1: 582-5.
7. De Onis M, Garza C, Habicht J-P. Time for a new growth reference. Paediatrics 1997; 100: E8.
8. de Onis M & Onyango AW. The Centers for Disease Control and Prevention 2000 growth charts and the growth of breastfed infants. Acta Paediatr 92: 413-9.
9. Robert SB, Dallal GE. The new childhood growth charts. Nutr Rev 59: 31-6.
10. de Onis M, Habicht JP. Anthropometric reference data for international use: recommendations from a World Health Organization Expert Committee. Am J Clin Nutr 1996; 64: 650-8.
11. de Onis M, Garza C & Habicht JP. Time for a new growth reference. Paediatrics 1997; 100:E8.
12. Victora CG, Morris SS, Barros FC, de Onis M, Yip R. The NCHS reference and the growth of breast-and bottlefed infants. J Nutr 1998; 128: 1134-8.
13. de Onis M, Yip R. The WHO Growth Chart: historical considerations and current scientific issues. Bibl Nutr Dieta 1996; 53: 74-89.
14. WHO Working Group on Infant Growth. An evaluation of infant growth: the use and interpretation of anthropometry in infants. Bull World Health Organ 1995; 73: 165-74.
15. Zuguo M, Ray Y, Grummer-Strawn LM, Trowbridge FL. Development of a research child growth reference and its comparison with the current international growth reference. Arch Pediatr Adolesc Med 1998; 152: 471-9.
16. Garza C, de Onis M. A new international growth reference for young children. Am J Clin Nutr 1999; 70: 169S-72S.
17. de Onis M, Onyango AW. The Centers for Disease Control and Prevention 2000 growth charts and the growth of breastfed infants. Acta Paediatr 2003; 92: 413-9.
18. Garza C, de Onis M. Introduction. Symposium: A New 21st-Century International Growth Standard for Infants and Young Children. J Nutr 2007; 137: 142-3.
19. de Onis M, Garza C, Onyango AW, Borghi E. Comparison of the WHO child growth standards and the CDC 2000 growth charts. Symposium: A New 21st-Century International Growth Standard for Infants and Young Children. J Nutr 2007; 137: 144-8.
20. WHO Multicentre Growth Reference Study Group. WHO Child Growth Standards based on length/height, weight and age. Acta Paediatr 2006; 450: 76-85.
21. WHO Multicentre Growth Reference Study Group. Assessment of differences in linear growth among populations in the WHO Multicentre Growth Reference Study. Acta Pediatr 2006; 450: 56-65.
22. de Onis M, Onyango AW, Borghi E, Siyam A, Nishidaa C, Siekmann J. Development of a WHO growth reference for school-aged children and adolescents. Bull World Health Organ 2007; 85: 660-7.
23. Growth reference data for 5-19 years. (Online) (Cited 2012 June 30). Available from URL: http://www.who.int/growthref/en/.
24. Ebrahimzade S. determining the standards of height and weight for 6-12 years old kids of mashad and comparing it with international standards. J Sabzevar Uni Med Sci 2002; 9: 61-9. (Persian)
25. Sohrabi A, Chehre Asa F. Survey on the body weight and height of the students of 7-11 years in zahedan. J Sabzevar Uni Med Sci 2002; 8: 58-64.
26. Azizi f, Malek afzali H, Fathi H. A survey on height and weight of Tehrani`s children. Darou va darman 1985; 3: 5-12. (Persian)
27. Taghavi N, Ebrahimi h, Karimi A, Pourheidari M. Evaluation of the height and weight of students aged 7-11 years in Shahrood, 2003-2005. Islamic Azad Uni Med J 2007; 17: 95-101.
28. Abolfotouh MA, Badawi IA. Growth pattern of Saudi schoolboys in a high-altitude area of Saudi Arabia. East Mediterr Health J 1995; 1: 205-9.
29. Medhi GK, Barua A, Mahanta J. Growth and Nutritional Status of School Age Children (6-14 Years) of Tea Garden Worker of Assam. J Hum Ecol 2006; 19: 83-5.
30. Prabhjot NK, Marwaha G, Sidhu S. Growth Pattern of Affluent School Children of Amritsar. Anthropologist 2005; 7: 261-4.
31. Hedayati Emami MH, Barzegar S, Esmaili MA. A survey on height and weight of Rasht and Sangar students. Gilan Uni Med Sci J 1993; 6: 12-20. (Persian)
32. Shidfar F, Montazer M, Amooian M, Azizi HR. A survey on height, weight and BMI of 6-15 years old girls in babol in between 1995-2001 and comparison of it with CDC 2000 standards. Food Technology Nutrition J Iran 2007; 2: 13-22.
Journal of the Pakistan Medical Association has agreed to receive and publish manuscripts in accordance with the principles of the following committees:


